See Every Rate. Across Every Market.
Rate Atlas maps negotiated rates from payers and hospitals nationwide — by state, metro, and ZIP — so you can instantly see where rates are too low, too high, or out of step with your market.
- All 50 states
- Updated monthly
- CPT & DRG level
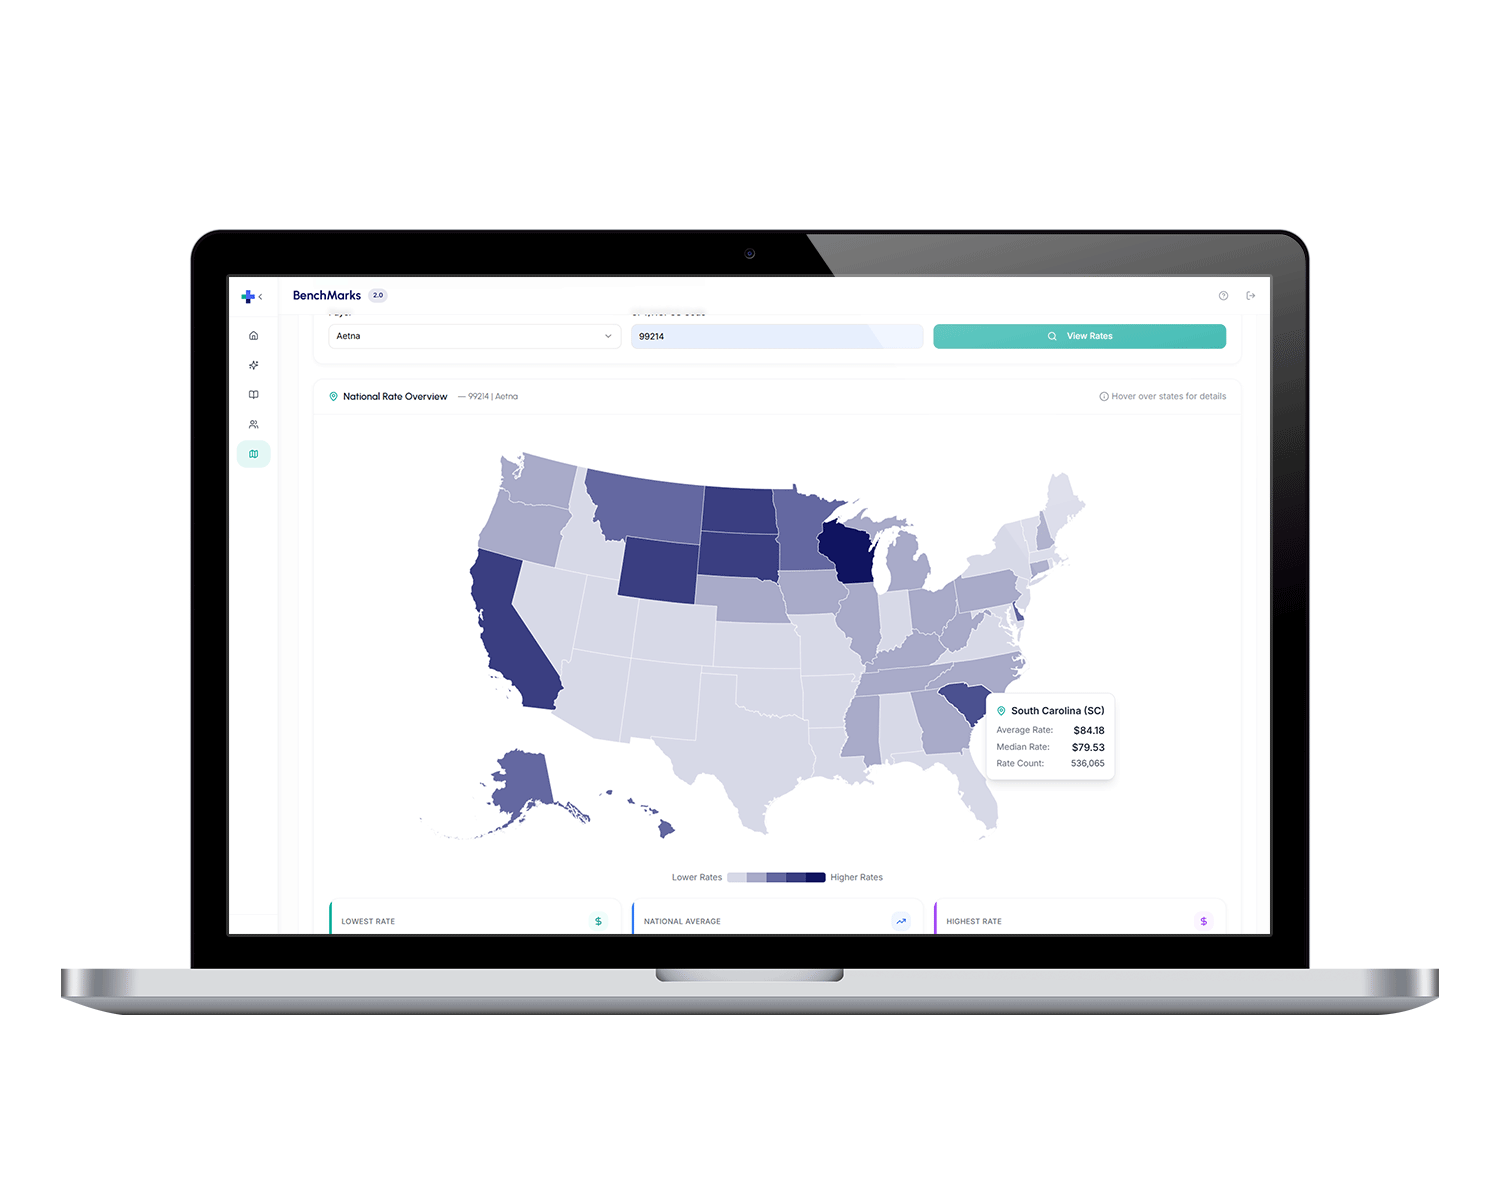
The full geographic picture of healthcare pricing
Rate Atlas layers payer contracts, provider networks, and geographic markets into one unified view — so you always know what rates look like where you operate.
Geographic Rate Mapping
Visualize negotiated rates at the state, MSA, and ZIP code level. Instantly see how pricing varies across markets for any procedure or DRG.
Payer-by-Payer Overlay
Layer individual payer contracts onto the map. Compare what Aetna, UHC, and BCBS pay for the same service across the same geography.
Rate Gap Identification
Surface markets where your rates sit significantly above or below the regional benchmark — and prioritize where renegotiation will have the most impact.
Network Density Analysis
Understand how provider network size correlates with rate variation. Find underserved markets where your leverage is strongest.
Nationwide Coverage
Rate Atlas draws from the same nationwide MRF dataset as BenchMarks — 5,000+ hospitals and 200+ payers across all 50 states, refreshed monthly.
Export & API Access
Pull geographic rate data directly via API or export to CSV, Excel, or your BI tool. Integrate Rate Atlas data into your existing market analytics stack.
Built for anyone who negotiates across geographies
Rate Atlas gives every stakeholder a shared map of what rates actually look like in the markets that matter to them.
Know Your Rate Position in Every Market You Operate
Multi-site health systems use Rate Atlas to identify geographic rate disparities across their network — and build a market-by-market negotiation strategy.
- Compare rates across all your markets simultaneously
- Identify sites where payer rates are farthest below benchmark
- Build a prioritized renegotiation pipeline by geography
- Track rate changes across markets after contract cycles
Price Competitively in Every Service Area
Payers use Rate Atlas to benchmark their network rates by geography — ensuring they stay competitive for provider recruitment without overpaying.
- See your rate position in each service area vs. market
- Identify geographies where your network rates are outliers
- Evaluate new market entries with real pricing data
- Monitor competitor rate movements by region
Deliver Geographic Market Studies That Win Business
Strategy consultants and healthcare analytics firms use Rate Atlas to produce geographic rate analyses and regional market assessments for their clients.
- Build geographic rate spread analyses for any service line
- Compare markets across states or MSAs for clients expanding networks
- Validate geographic assumptions in financial models
- Produce board-ready regional benchmark reports